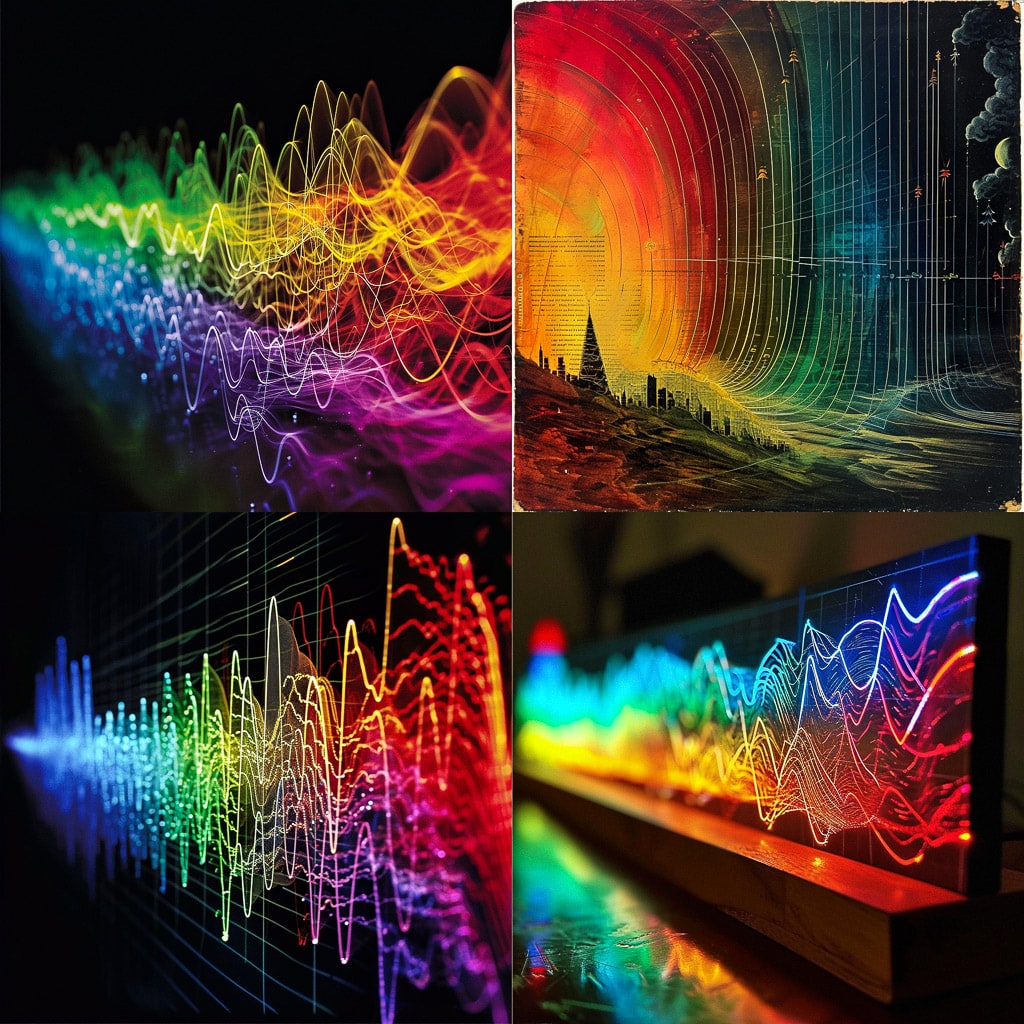
Chart of the electromagnetic spectrum is a visual representation of the range of electromagnetic waves, including radio waves, microwaves, infrared, visible light, ultraviolet, X-rays, and gamma rays. It helps to understand the differences in wavelengths and frequencies of these waves. The chart can be used in various fields such as physics, engineering, and astronomy. It is a valuable tool for scientists and researchers to study and analyze different types of electromagnetic radiation. The chart's design can vary, but it typically includes color-coded sections to represent different wave types and numerical scales to indicate wavelengths and frequencies.
Electromagnetic spectrum chart
Используйте его в своих промптах:
by Electromagnetic spectrum chart

